
The lagometer is a display of network latency on an Internet connection and of rendering by the client.
It can be activated by opening the console and typing /cg_lagometer 1. or you can bind a key to show/hide this graph with this script in your cfg:
set lag_on "set CG_LAGOMETER 1; set tog_lag
vstr lag_off"
set lag_off "set CG_LAGOMETER 0; set tog_lag vstr lag_on"
set tog_lag vstr lag_on
bind "YOUR KEY HERE" tog_lag
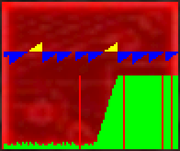
There are two graphs in the lagometer, one above the other.
Upper graph
The upper graph advances one pixel for every rendered frame on the client side. Blue lines below the baseline mean that the frame is interpolating between two valid snapshots. Yellow lines above the baseline mean the frame is extrapolating beyond the latest valid time. The length of the line is proportional to the time.
Basically, blue is good: it’s based on two snapshots received from the server, so the frame will not be revoked. Yellow means that the client is predicting what will happen, but hasn’t received a snapshot to corroborate it yet. If the next snapshot comes in and doesn’t correspond to the prediction, the prediction is revoked and the client is update with the snapshot data. This results in the skipping you experience where you’ll end up somewhere very different from where you thought you were (and often with less health than you thought, because you were shot on the server, but the client couldn’t predict that happening for you).
The upper graph indicates the consistency of your connection. Ideally, you should always have blue bars of only a pixel or two in height. If you are commonly getting big triangles of yellow on the graph, your connection is inconsistent.
Lower graph
The lower graph slides one pixel for every snapshot received (or not received) from the server. By default, snapshots come 20 times a second, so if you are running >20 fps, the top graph will move faster, and vice versa. A red bar means the snapshot was dropped by the network (indicating packet loss). Green and yellow bars are properly received snapshots, with the height of the bar proportional to the ping. A yellow bar indicates that the previous snapshot was intentionally supressed to stay under the rate limit.
In a heavy firefight, it is normal for modem players to see yellow bars in the bottom graph, which should return to green when the action quiets down. If you are getting several red bars visible, you may want to look for a server that drops less packets.